This post is the continuation of our original GC overhead limit exceeded problem patterns post. Proper Java Heap analysis is critical in order to eliminate your OutOfMemoryError: GC overhead problem. If you are not familiar with this Java HotSpot 1.6 error, I recommend that you first review my First Article on this subject.
Sample Java program

As you can see, the JVM generated a Heap Dump file java_pid3880.hprof. It is now time to fire the Memory Analyzer tool and analyze the JVM Heap Dump.


This article will provide you with a sample program and a tutorial on how to analyze your Java HotSpot Heap footprint using Memory Analyzer following an OutOfMemoryError. I highly recommend that you execute and analyse the Heap Dump yourself using this tutorial in order to better understand these principles.
Troubleshooting tools
** all these tools can be downloaded for free **
· Eclipse Indigo Release
· Memory Analyzer via IBM Support Assistant 4.1 (HotSpot Heap Dump analysis)
· Java VM: Windows HotSpot JRE 1.6.0_24 64-bit
Sample Java program
The simple sample Java program below will be used to triggered an OutOfMemoryError; allowing us to analyze the generated HotSpot Heap Dump file. Simply create a new Java class : JVMOutOfMemoryErrorSimulator.java to the Eclipse project of your choice and either rename or keep the current package as is.
This program is basically creating multiple String instances within a Map data structure until the Java Heap depletion.

** please make sure your Eclipse compiler and JRE is 1.6 **
package org.ph.javaee.javaheap;
import java.util.Map;
import java.util.HashMap;
/**
* JVMOutOfMemoryErrorSimulator
*
* @author PH
*
*/
public class JVMOutOfMemoryErrorSimulator {
private final static int NB_ITERATIONS = 500000;
// ~1 KB data footprint
private final static String LEAKING_DATA_PREFIX = "datadatadatadatadatadatadatadatadatadatadatadatadatadatadatadatadatadatadatadatadatadatadatadatadatadatadatadatadatadatadatadatadatadatadatadatadatadatadatadatadatadatadatadatadatadatadatadatadatadatadatadatadatadatadatadatadatadatadatadatadatadatadatadatadatadatadatadatadatadatadatadatadatadatadatadatadatadatadatadatadatadatadatadatadatadatadatadatadatadatadatadatadatadatadatadatadatadatadatadatadatadatadatadatadatadatadatadatadatadatadatadatadatadatadatadatadatadatadata";
// Map used to stored our leaking String instances
private static Map<String, String> leakingMap;
static {
leakingMap = new HashMap<String, String>();
}
/**
* @param args
*/
public static void main(String[] args) {
System.out.println("JVM OutOfMemoryError Simulator 1.0");
System.out.println("Author: Pierre-Hugues Charbonneau");
System.out.println("http://javaeesupportpatterns.blogspot.com/");
try {
for (int i = 0; i < NB_ITERATIONS; i++) {
String data = LEAKING_DATA_PREFIX + i;
// Add data to our leaking Map data structure...
leakingMap.put(data, data);
}
} catch (Throwable any) {
if (any instanceof java.lang.OutOfMemoryError) {
System.out.println("OutOfMemoryError triggered! "
+ any.getMessage() + " [" + any + "]");
} else {
System.out.println("Unexpected Exception! " + any.getMessage()
+ " [" + any + "]");
}
}
System.out.println("simulator done!");
}
}
Step #1 - Setup your JVM start-up arguments
First, setup your Eclipse Java runtime arguments as per below. For our example, we used an external JRE 1.6 outside the Eclipse IDE with a Java Heap maximum capacity of 512 MB.
The key JVM argument allowing us to generate a Heap Dump is -XX:+HeapDumpOnOutOfMemoryError which tells the JVM to generate a Heap Dump following an OutOfMemoryError condition.
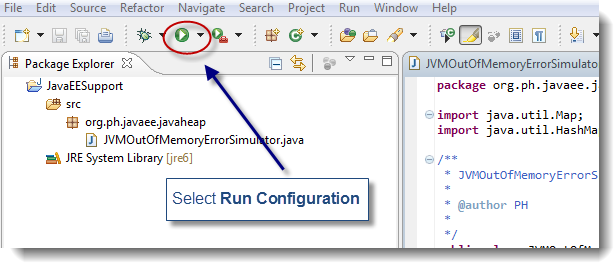

The next step is to run our Java program. Depending on your computer specs, this program will run between 5-30 seconds before existing with an OutOfMemoryError.
Step #3 - Load the Heap Dump
Analyzing a Heap Dump is an analysis activity that can be simple or very complex. The goal of this tutorial is to give you the basics of Heap Dump analysis. For more Heap Dump analysis, please refer to the other case studies of this Blog.
Step #4 - Analyze Heap Dump
Below are the snapshots and analysis steps that you can follow to understand the memory leak that we simulated in our sample Java program.
As you can see, the Heap Dump analysis using the Memory Analyzer tool was able to easily identify our primary leaking Java class and data structure.
Conclusion
I hope this simple Java program and Heap Dump analysis tutorial has helped you understand the basic principles of Java Heap analysis using the raw Heap Dump data. This analysis is critical when dealing with OutOfMemoryError: GC overhead problems since those are symptoms of either Java Heap leak of Java Heap footprint / tuning problem.
Please feel free to post any comment, question or email me if you have any question.
Having the latest technology really helps for all projects. A Lenovo coupons can save money on a new computer.

13 comments:
Excellent Article !!!
Hi P-H,
I want to add one more point here. In some cases if we used 512m then It would not generate heap dump because program will not touch to OutOfMemory. In this case if we run this program with only -XX:+HeapDumpOnOutOfMemoryError argument then it will get OutOfMemory anf heap dump will also get generate.
Regards,
Sujit
Hi P-H,
To fix this issue one of the option is that change the value of
private final static int NB_ITERATIONS = 500000;
Regards,
Sujit
Thanks Sujit for the extra points,
Yes you can adjust the static counter as per desired in order to generate an OOM from your local environment. The goal of this simple program is to generate a binary Heap Dump for you to analyze.
Regards,
P-H
Hi P-H,
This article is really good and after going thru this Now I am able to understand the heap dump better.
Thanks for this article P-H.
Regards,
Sujit
Thanks for your comments Sujit,
Happy to help here.
P-H
Nice Article.
Thanks a million!
Hi Pierre,
Your link to your 'First Article' does not seem to work. Thanks for the great work.
Thanks Ashley, I just fixed the broken link.
Regards,
P-H
Hi Pierre,
How can I generate dynamically a heapdump to analyse later from an application running in ibm WAS 8.5 and the JVM from IBM (JVM: IBM J9 VM (2.6, JRE 1.7.0 Windows 7 x86-32.
I used Jconsole or visualVM from oracle JDK 1.7 to generate a heapdump but it seems that Heap dump on OOME: disabled. Is there another way? Thanks in advance, Said
Hi Said,
Please follow the steps from the article below, it includes the parameter that you will need to manually trigger a heap dump for IBM JVM, using kill -3 command.
http://javaeesupportpatterns.blogspot.com/2012/11/java-heap-dump-are-you-up-to-task.html
Thanks.
P-H
Hey I have worked on this example.Can you please provide the related example to rectify/avoid this leaks.
Hi, please have a look at the following video, it provides a case study how to analyze a memory leak using Eclipse MAT.
https://www.youtube.com/watch?v=5joejuE2rEM
Post a Comment