/ August 2011 ~ Java EE Support Patterns

8.23.2011

ORA-01502 Problem case study

This case study describes the complete root cause analysis and resolution of an Oracle 10gR2 database problem (ORA-01502) affecting a Weblogic Portal 10.0 Java EE application.

Environment specifications

-          Java EE server: Oracle Weblogic Portal 10.0 MP1
-          Database server: Oracle 10gR2
-          Middleware OS: Sun Solaris 5.10
-          Database server OS: IBM AIX 5.3 TL5
-          JDK: Sun Java HotSpot(TM) Server VM Version 1.5.0_11
-          Platform type: Internet facing Portal platform

Problem overview

·       Problem type: java.sql.SQLException: [BEA][Oracle JDBC Driver][Oracle]ORA-01502: index '<INDEX NAME>' or partition of such index is in unusable state

A SQLException error was observed from the Weblogic Portal server logs. This Exception was thrown from the remote Oracle database when trying to execute a SELECT SQL for one of our table.

The Weblogic JDBC Data Source associated with this table was also disabled by Weblogic: weblogic.common.resourcepool.ResourceDeadException: Pool <JDBC Pool Name> is disabled, cannot allocate resources to applications

Gathering and validation of facts

As usual, a Java EE problem investigation requires gathering of technical and non technical facts so we can either derived other facts and/or conclude on the root cause. Before applying a corrective measure, the facts below were verified in order to conclude on the root cause:

·       What is the client impact? HIGH (this Oracle table is part of our login process for our users)
·       Recent change of the affected platform? No
·       Any recent traffic increase to the affected platform? No
·       Since how long this problem has been observed?  This error suddenly appeared for the first time early in the morning
·       What is the health of the Oracle database server? Our Oracle DBA did confirm he was able to replicate the same SQL error by running a SQL directly from SQL*Plus. The overall health of the database appeared to be fine
·       Did a restart of the Weblogic Integration server resolve the problem? No

-          Conclusion #1: The problem seems to be isolated on the Oracle database server side and related to a corruption of one of the table index (ORA-01502).

ORA-01502: what is it?

Find below the Oracle notes on this error:

ORA-01502: index "string.string" or partition of such index is in unusable state

Cause: An attempt has been made to access an index or index partition that has been marked unusable by a direct load or by a DDL operation 

Action: DROP the specified index, or REBUILD the specified index, or REBUILD the unusable index partition

Weblogic log file analysis: ORA-01502!

A first analysis of the problem was done by reviewing the Weblogic portal managed server log errors.

java.sql.SQLException: [BEA][Oracle JDBC Driver][Oracle]ORA-01502: index '<Index Name>' or partition of such index is in unusable state
       at weblogic.jdbc.base.BaseExceptions.createException(Unknown Source)
       at weblogic.jdbc.base.BaseExceptions.getException(Unknown Source)
       at weblogic.jdbc.oracle.OracleImplStatement.execute(Unknown Source)
       at weblogic.jdbc.base.BaseStatement.commonExecute(Unknown Source)
       at weblogic.jdbc.base.BaseStatement.executeQueryInternal(Unknown Source)
       at weblogic.jdbc.base.BasePreparedStatement.executeQuery(Unknown Source)
       at weblogic.jdbc.wrapper.PreparedStatement.executeQuery(PreparedStatement.java:97)
       at org.<App Code>(AppDAOClass.java)
       at org.<App Code>(AppClass.java)
       at org.<App Code>.doFilter(AppFilterClass.java)
       at weblogic.servlet.internal.FilterChainImpl.doFilter(FilterChainImpl.java:42)
       at weblogic.servlet.internal.FilterChainImpl.doFilter(FilterChainImpl.java:42)
       at com.bea.portal.tools.servlet.http.HttpContextFilter.doFilter(HttpContextFilter.java:60)
       at weblogic.servlet.internal.FilterChainImpl.doFilter(FilterChainImpl.java:42)
       at com.bea.p13n.servlets.PortalServletFilter.doFilter(PortalServletFilter.java:336)
       at weblogic.servlet.internal.FilterChainImpl.doFilter(FilterChainImpl.java:42)
       at weblogic.servlet.internal.WebAppServletContext$ServletInvocationAction.run(WebAppServletContext.java:3393)
       at weblogic.security.acl.internal.AuthenticatedSubject.doAs(AuthenticatedSubject.java:321)
       at weblogic.security.service.SecurityManager.runAs(Unknown Source)
       at weblogic.servlet.internal.WebAppServletContext.securedExecute(WebAppServletContext.java:2140)
       at weblogic.servlet.internal.WebAppServletContext.execute(WebAppServletContext.java:2046)
       at weblogic.servlet.internal.ServletRequestImpl.run(Unknown Source)
       at weblogic.work.ExecuteThread.execute(ExecuteThread.java:200)
       at weblogic.work.ExecuteThread.run(ExecuteThread.java:172)

As you can see, the ORA-01502 error was thrown during the execution of our SELECT SQL from our application.

Root cause: duplicate primary key row data!

Investigation by our DBA team did confirm that our nightly data refresh process ended up injecting duplicate primary key row data to this table; causing the index of this table to go in unusable state.

Such bad INDEX state caused all our SQL executions fired from the Weblogic portal server to fail in a systematic manner with the ORA-01502 error.

Solution: a 4 steps resolution process!

#1 - First drop the unique constrain associated with the affected index

alter table <TABLE NAME> drop constraint <CONSTRAINT NAME>;

#2 - Now drops the affected index

drop index <INDEX NAME>;

#3 - Run a script to detect and remove duplicate rows as per the example below

select t.order_id, t.creation_date count(*) from affected_table t group by t.order_id, t.creation_date count(*) > 1

#4 – Finally, rebuild the index and its associated unique PK constraint

create index <INDEX NAME> on <TABLE NAME>(PK COLUMN NAME);
alter table <TABLE NAME> add primary key(PK COLUMN NAME) NOVALIDATE ;

Conclusion and recommendations

-          When facing ORA-01502 with Oracle, please ensure to do a fast and complete root cause analysis. If your problem is related to duplicate data, please ensure you also identify the trigger e.g. which update process that triggered the duplicate data itself in order to prevent the problem in the future
-          Avoid taking unnecessary and non efficient resolution steps such as an early Weblogic restart or Oracle database restart

8.22.2011

GC overhead limit exceeded - Problem and analysis approach

This short article will provide you with a description of this new JVM 1.6 HotSpot OutOfMemoryError error message and how you should attack this problem until its resolution.

You can also refer to this post for a real case study on a Java Heap problem (OutOfMemoryError: GC overhead limit exceeded) affecting a JBoss production system.

Please also feel free to post any comment or question if you need help with your problem.

java.lang.OutOfMemoryError: GC overhead limit exceeded – what is it?

Everyone involved in Java EE production support is familiar with OutOfMemoryError problems since they are one of the most common problem type you can face. However, if your environment recently upgraded to Java HotSpot 1.6 VM, you may have observed this error message in the logs: java.lang.OutOfMemoryError: GC overhead limit exceeded.

GC overhead limit exceeded is a new policy that was added by default for the Java HotSpot VM 1.6 only. It basically allows the VM to detect potential OutOfMemoryError conditions earlier and before it runs out of Java Heap space; allowing the JVM to abort the current Thread(s) processing with this OOM error.

The policy criterias are based on the elapsed time and frequency of your VM GC collections e.g. GC elapsed time too high, too many Full GC iterations or too much time spent in GC can trigger this error.

The official Sun statement is a par below:
The parallel / concurrent collector will throw an OutOfMemoryError if too much time is being spent in garbage collection: if more than 98% of the total time is spent in garbage collection and less than 2% of the heap is recovered, an OutOfMemoryError will be thrown. This feature is designed to prevent applications from running for an extended period of time while making little or no progress because the heap is too small. If necessary, this feature can be disabled by adding the option -XX:-UseGCOverheadLimit to the command line.

Is it useful for Java EE production systems?

I have found on most of my problem cases that this new policy is useful at some level since it is preventing a full JVM hang and allowing you to take some actions such as data collection, JVM Heap Dump, JVM Thread Dump etc. before the whole JVM becomes unresponsive.

But don’t expect this new feature to fix your Java Heap problem, it is meant to prevent a full JVM hang and to abort some big memory allocation etc. you must still perform your own analysis and due diligence.

Is there any scenario where it can cause more harm than good?

Yes, Java applications dealing with large memory allocations / chunks could see much more frequent OOM due to GC overhead limit exceeded. Some applications dealing with a long GC elapsed time but healthy overall memory usage could also be affected.

In the above scenarios, you may want to consider turning OFF this policy and see if it’s helping your environment stability.

java.lang.OutOfMemoryError: GC overhead limit exceeded – can I disable it?

Yes, you can disable this default policy by simply adding this parameter at your JVM start-up:

-XX:-UseGCOverheadLimit

Please keep in mind that this error is very likely to be a symptom of a JVM Heap / tuning problem so my recommendation to you is always to focus on the root cause as opposed to the symptom.

java.lang.OutOfMemoryError: GC overhead limit exceeded – how can I fix it?

You should not worry too much about the GC overhead limit error itself since it’s very likely just a symptom / hint. What you must focus on is on your potential Java Heap problem(s) such as Java Heap leak,  improper Java Heap tuning etc. Find below a list of high level steps to troubleshoot further:

·         If not done already, enabled verbose GC >> -verbose:gc
·         Analyze the verbose GC output and determine the memory footprint of the Java Heap; including the ratio of Young Gen vs. Old Gen.. Having an old gen footprint too high will lead to too many frequent Full GC and ultimately to the OOM :  GC overhead limit exceeded
·         Analyze the verbose GC output or use a tool like JConsole to determine if your Java Heap is leaking over time. This can be observed via monitoring of the HotSpot old gen space.
·         Look at your young Gen requirement as well, if you application generates a lot of short live objects then your Java Heap space must be big enough in order for the VM to allocate a bigger Young Gen space
·         If facing a Java Heap leak and / or if you have concern on your Old Gen footprint then add the following parameter to your start-up JVM arguments: -XX:+HeapDumpOnOutOfMemoryError . This will generate a Heap Dump (hprof format) on OOM event that you can analyze using a tool like Memory Analyzer or JHat.

8.18.2011

Stuck Thread how to resolve part 1

In my Java EE production support experience, stuck threads is by far the most common production problem you will face in your day to day work. Some of these problems are straightforward while others are very complex to pinpoint. This issue is quite common, regardless of the Java EE server that you use (Weblogic, WAS, JBoss etc.).

This article is the part #1 of a series of articles which I will share with you my knowledge on stuck Thread related problems; including root cause analysis, which tools to use, how to take corrective actions and how to prevent stuck Threads at the first place. So please come back regularly for more updates on this topic.

For now, let’s start with the basics and understanding of Thread Pools in the Java EE container world.

Java EE container and Thread Pools

Thread Pools are part of the foundation of your Java EE container. Every new request that comes in to your application server will at some point require a Java Thread allocation in order to execute its task. Executing each request in its own separate Java Thread provides the container with multi Thread and concurrent processing capabilities.

Find below a simple diagram showing you an example of 2 concurrent HTTP requests reaching a Weblogic 11g server:

Why are Threads getting stuck?

As you can see from the diagram, the Threads are executing the actual allocated request from the Weblogic Kernel. Most of the problems happen when the Thread execution is reaching the application or business layer.

At this point your application Java code modules will be performing a lot of business logics, including sending and receiving data from external sources such as a Web Service or an Oracle database for example. Any problem with such external system will cause the Thread to hang and wait for data to come back.

Other situations can occur such as internal deadlock, infinite looping, heavy IO contention on your server etc.


What can you do about it?

Please note that I'm currently working on a Thread Dump analysis training plan available from this Blog. I highly recommend that you read it; I'm confident that it will greatly improve your Thread Dump analysis skills and help you prevent and resolve stuck Thread problems.

Finally, please feel free to submit your Thread Dump data to the Root Cause Analysis Forum or via my email address @phcharbonneau@hotmail.com and I will analyze it for you.

8.15.2011

java.lang.NoClassDefFoundError Problem patterns

Getting a java.lang.NoClassDefFoundError when supporting a Java EE application is quite common and at the same time complicated to resolve.

The article will provide you with the common problem patterns responsible for java.lang.NoClassDefFoundError problems.

I’m also working on a real life case study on this subject which I will make available shortly from this Blog.


java.lang.NoClassDefFoundError– what is it?

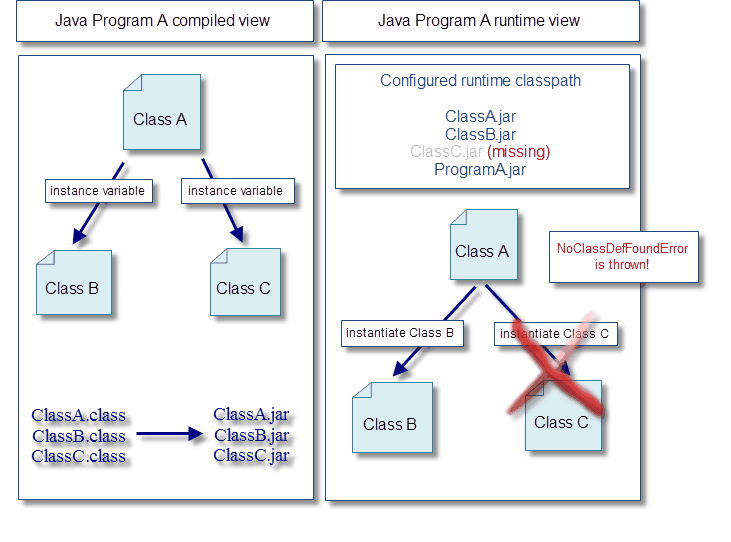
This runtime error is thrown by the JVM when it tries to load the definition of a Class and when such Class definition could not be found in the current Class loader tree.

This normally means that the compiled version of the reference to this Class was done successfully but that such reference at runtime can not be found.

Sound confusing? Let’s have a look at the visual diagram below so you can better understand this fundamental problem.


Now if you are interested, find below the source code of our sample program along with java.lang.NoClassDefFoundError error.

// ClassA.java
 
package com.cgi.tools.java;

public class ClassA {
     private ClassB instanceB = null;
     private ClassC instanceC = null;
    
     public ClassA() {
           instanceB = new ClassB();
           instanceC = new ClassC();
     }
}

// ClassB.java
package com.cgi.tools.java;

public class ClassB {

}


// ClassC.java
package com.cgi.tools.java;

public class ClassC {

}


// ProgramA.java
package com.cgi.tools.java;

public class ProgramA {

     /**
      * @param args
      */
     public static void main(String[] args) {
          
           try {
                ClassA instanceA = new ClassA();
               
                System.out.println("ClassA instance created properly!");
           }
           catch (Throwable any) {
                System.out.println("Unexpected problem! "+any.getMessage()+" ["+any+"]");
           }   
     }

}

## ProgramA runtime classpath and output – with ClassC.jar

java -classpath ClassA.jar;ClassB.jar;ClassC.jar;ProgramA.jar com.cgi.tools.java.ProgramA


ClassA instance created properly!


## ProgramA runtime classpath and output – without ClassC.jar

// We voluntarily omitted to add ClassC.jar in the System classpath
java -classpath ClassA.jar;ClassB.jar;ProgramA.jar com.cgi.tools.java.ProgramA

Unexpected problem! com/cgi/tools/java/ClassC

[java.lang.NoClassDefFoundError: com/cgi/tools/java/ClassC]

What are the most common scenarios causing NoClassDefFoundError?

There are a few common scenarios which can lead to NoClassDefFoundError in your Java EE environment or standalone Java program.

# Problem pattern #1 – Missing vendor or third party library in System classpath or Java EE App classloader

A missing Java library of your Java EE server itself (Weblogic, WAS, JBoss etc.) or third party (Apache, Spring, Hibernate etc.) is the most common program; exactly like our above sample program.

# Solution

Resolution requires proper root cause analysis as per below recommended steps:

1)       Review the NoClassDefFoundError error and identify the missing Java Class
2)       Search through your local development and / or build environment and identify which Jar file contains the missing Java Class
3)       Once jar file(s) is / are identified, compare your local / build classpath with your production / problematic environment
4)       Resolution may include adding the missing JAR file(s) to the System class path or to your application EAR file for example

# Problem pattern #2 - Vendor or third party library version mismatch in System classpath or Java EE App classloader

This problem pattern is less common but trickier to pinpoint the root cause. This is a normally caused by using wrong version of a shared third party library like Apache commons logging etc.

# Solution

The resolution is quite similar to pattern #1:

1)       Review the NoClassDefFoundError error and identify the missing Java Class along with the referrer (very important)
2)       Search through your local development and / or build environment and identify which Jar file contains the missing Java Class
3)       Search through your local development and / or build environment and identify which Jar file contains the referrer Java Class
4)       Once jar file(s) is / are identified, compare your local / build classpath with your production / problematic environment
5)       Resolution may include replacing the problematic JAR file(s) with the right version as per the third party API documentation; this might include replacement of the JAR file referrer depending on your root cause analysis results

# Problem pattern #3 – static{} block code failure

This problem pattern is also quite common and can take some time to pinpoint. Java offers the capability to write some code to be executed once in life time of the JVM / Class loader. This is achieved via a static{} block, called static initializer, normally located right after the class instance variables.

Unfortunately, proper error handling and “non happy paths” for static initializer code blocks are often overlooked which opens the door for problems.

Any failure such as an uncaught Exception will prevent such Java class to be loaded to its class loader.  The pattern is as per below:

·         the first attempt to load the class will generate a java.lang.ExceptionInInitializerError; preventing the class loader to load the referenced class
·         subsequent calls will then generate a java.lang.NoClassDefFoundError from any other referencing classes in a consistent manner until the problem is resolved and the JVM restarted (or live redeploy via your Java EE server redeploy task)

# Solution

Resolution requires proper root cause analysis as per below recommended steps:

1)       Review the NoClassDefFoundError error and identify the affected Java Class
2)       Perform a code review of the affected Java class and see if any static{} initializer block can be found
3)       If found, review the error handling and add proper try{} catch{} along with proper logging in order to understand the root cause of the static block code failure
4)       Compile, redeploy, retest and confirm problem resolution

Final words

I hope this article has helped you better understand under which condition the JVM is throwing a NoClassDefFoundError error and the common causes.

If you still have any doubt, please feel free to add a comment or question if you are still struggling to identify the root cause of your NoClassDefFoundError problem.

The network adapter could not establish the connection - Problem patterns

The article will provide you with the common problem patterns responsible to throw the Oracle JDBC Driver error: The network adapter could not establish the connection.
You can also visit another post on this subject describing a real life Case Study on this problem.

The network adapter could not establish the connection – what is it?

This error message is actually the result of an Oracle JDBC driver NT error 20 or 99 (NT connection failed).

The Oracle JDBC driver has a built-in table of its entire internal error message. This can be found under the jar file (ojdbc14.jar / ojdbc6.jar) structure >> oracle/net/mesg/Message.properties

The Network Adapter could not establish the connection is an actual translation of an NT error code 20 or 99 which means the JDBC driver was unable to physically connect to your remote Oracle database.


What are the most common patterns of this problem?

There are a few common scenarios which can lead to this JDBC driver from the most trivial to the harderst problem. Find below of list of the most common patterns. Please review and determine which one is applicable for your current problem scenario:

# Problem pattern #1

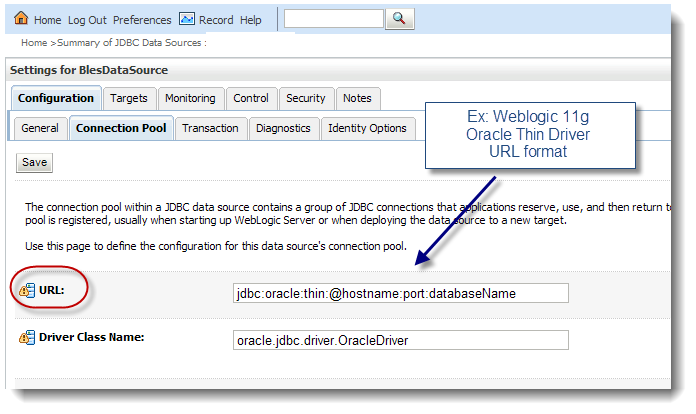
A wrong configuration of your Java EE server JDBC Data Source (connection pool) configuration or stand alone JDBC Connection URL values and / or format:

-  A wrong hostname or IP of your Oracle database listener
-  A wrong port of your Oracle database listener
-  A wrong client server host file pointing to a wrong destination / IP address

Ex: Weblogic 11g JDBC DataSource Connection Pool settings for Oracle thin JDBC Driver


Ex: Simple JDBC Connection creation code using the DriverManager

# Problem isolation & reproduction

Have a look at your JDBC Data Source or JDBC Connection and perform a connectivity testing using telnet against your configured Oracle hostname and port settings:

telnet <Oracle listener hostname> <Oracle listener port>

If successfully reproduced, the telnet should either return you unknown host, connection refused or should hang for a long period of time.

# Solution

-     Update your JDBC Data Source or JDBC Connection settings as per proper values in your environment. You should ask your DBA team for proper database access detail

# Problem pattern #2

The network adapter could not establish the connection error is suddenly thrown at runtime with major impact to your application and in a consistent manner (not intermittent). This problem is also quite common and has a few different flavours.

Possible causes:

·         The Oracle database listener encountered an expected problem and terminated  (Oracle listener port is closed)
·         Your remote Oracle database server is no longer physically reachable (network or hardware failure like a NIC card etc.)
·         Your server hosting your client application can no longer each your remote Oracle database server (network problem or hardware failure like a NIC card etc.)


# Problem isolation & reproduction

Depending of where your problem is isolated e.g. client or server side. Use telnet to replicate the problem as per below.

telnet <Oracle listener hostname> <Oracle listener port>

If successfully reproduced, the telnet should either return you unknown host, connection refused or should hang for a long period of time.

You can also use the traceroute command to assess the health from a network perspective through the different HOPS between your client server and remote Oracle DB server.

traceroute <Oracle listener hostname>

Finally, you should also request your DBA team to use the Oracle TNSPING utility to validate the health of your remote Oracle database listener.

# Solution

·         If problem is related to a failed Oracle database listener, ask your DBA team to restart the Oracle listener and secure logs / Oracle errors for future root cause analysis
·         If problem is network related then you will need to isolate first on why side e.g. client or server then deep dive further with your system admin and / or network team until resolution (router, switch problem, NIC card etc.)


# Problem pattern #3

The network adapter could not establish the connection error is thrown at runtime with in an intermittent manner. This problem is less common but you could face a few occurrences from time to time.

I suggest your review another post this Blog for a complete case study on the pattern #3.

Possible causes:

·         The network latency between your client and remote Oracle DB server has increased and causing intermittent connection timeout
·         Packet losses are observed between your client and remote DB server which can lead to intermittent The network adapter could not establish the connection errors
·         Your client or remote physical server could having a problem with one of its NIC card or internal routing table leading to intermittent The network adapter could not establish the connection errors


# Problem isolation & reproduction

Use telnet and traceroute and attempt to replicate the problem as much as you can.

telnet <Oracle listener hostname> <Oracle listener port>
traceroute <Oracle listener hostname>


Setup a ping monitoring script between your client server and remote DB server in order to identify if your are facing packet loss related problem.

# Send 5 packets of 64 bytes to the remote database IP address
ping -c 5 -q -s 64 <IP address>

# Solution

·         You should engage both your system admin and network team in order to investigate further. The system admin should perform basic system check, review OS error logs etc. Your network team should focus on the problem replicate between your source (client) & destination (DB server) and isolate the problem further
·         Again, the resolution can include fixing a problem with server hardware and / or network hardware such as a router or a switch

Final words

I hope this article has helped you understand the common causes of this Oracle JDBC Driver error.
Please feel free to add a comment or question if you are still struggling to identify the root cause of your The network adapter could not establish problem.

8.12.2011

Java Heap space - HotSpot VM

This short article will provide you with a high level overview of the different Java Heap memory spaces of the Sun Java HotSpot VM. This understanding is quite important for any individual involved in production support given how frequent memory problems are observed such as OutOfMemoryError.

Future articles will cover more advanced topics such as the different Java Heap spaces such as Young Gen and Old gen associated to each particular garbage collection policy.

Please feel free to also visit the other posts below for case studies on real production system OutOfMemoryError problems.


HotSpot VM: 3 memory spaces

The JVM HotSpot memory is split between 3 memory spaces:

·         The Java Heap
·         The PermGen (permanent generation) space
·         The Native Heap (C-Heap)


Memory Space
Start-up arguments and tuning
Monitoring strategies
Description
Java Heap
-Xmx (maximum Heap space)

-Xms (minimum Heap size)

EX:
-Xmx1024m
-Xms1024m
- verbose GC
- JMX API
- JConsole
- Other monitoring tools
The Java Heap is storing your primary Java program Class instances.
PermGen
-XX:MaxPermSize (maximum size)

-XX:PermSize
(minimum size)


EX:
-XX:MaxPermSize=512m
-XX:PermSize=256m
- verbose GC
- JMX API
- JConsole
- Other monitoring tools
The Java HotSpot VM permanent generation space is the JVM storage used mainly to store your Java Class objects such as names and method of the Classes, internal JVM objects and other JIT optimization related data.
Native Heap
 (C-Heap)
Not configurable directly.

For a 32-bit VM, the C-Heap capacity = 4 Gig – Java Heap - PermGen

For a 64-bit VM, the C-Heap capacity = Physical server total RAM & virtual memory – Java Heap - PermGen
- Total process size check in Windows and Linux
- pmap command on Solaris & Linux
- svmon command on AIX
The C-Heap is storing objects such as MMAP file, other JVM and third party native code objects.