A JVM Heap Dump is a crucial collection of information that provides full view on your Java EE application memory footprint. This article provides a step by step tutorial on how you can analyze an AIX IBM SDK Heap Dump in order to identify the Java Heap memory session data footprint of your Java EE Web application.
http://www-01.ibm.com/software/support/isa/
Conclusion
This Heap Dump analysis did clearly demonstrate how powerful such Heap Dump data is when combined with a tool like Memory Analyzer.
Heap Dump files allow you to perform a fast analysing of your application footprint without any need to install additional application profilers. There are some scenarios that you will need a real application profiler but Heap Dump analysis is quite sufficient in several scenarios and is available out-of-the-box for most JVM vendors.
Please note that we will use a real production system as an example following a session data footprint analysis we did on an older Weblogic 8.1 Web ordering application.
Environment specifications
· Java EE server: Weblogic 8.1 SP6
· Hardware: IBM,9117-MMA - PowerPC_POWER6
· OS: AIX 5.3
· JDK: IBM AIX SDK 1.4.2 SR9
· Platform type: Ordering Portal
Monitoring and troubleshooting tools
· JVM Heap Dump (IBM AIX format)
· Memory Analyzer 0.6.0.2 (via IBM Support Assistant 4.1)
Problem overview
An increased of Java Heap memory footprint was observed following a major release of our application. As part of our capacity planning process, it was agreed to delay the production release in order to identify the root cause along with a resolution.
Memory Analyzer background
The Memory Analyzer is one of best tool available that allows you to load and analyze both HotSpot (xyz.hprof format) and IBM SDK (heapdump.xyz.phd format) Java VM Heap Dump files.
This tool can be downloaded as a plug-in within the IBM Support Assistant (ISA) tool:
http://www-01.ibm.com/software/support/isa/
Heap Dump analysis
The first step is to download the Heap Dump file from your server to your workstation then please follow the instructions below:
1) Open ISA > Launch Activity > Analyze Problem
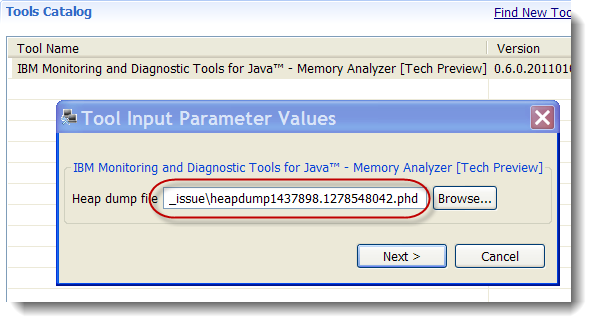
2) Launch Memory Analyzer > Browse > Remote Artifact > Select your file and click Next

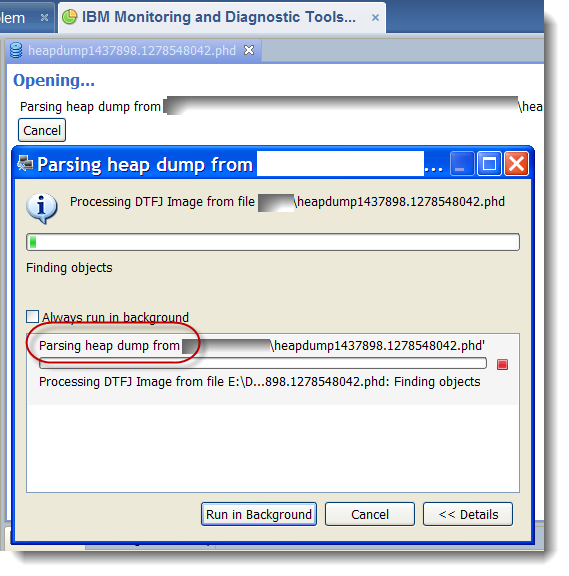
3) Wait until parsing is completed; this may take several minutes depending on Heap Dump size and specifications of your system

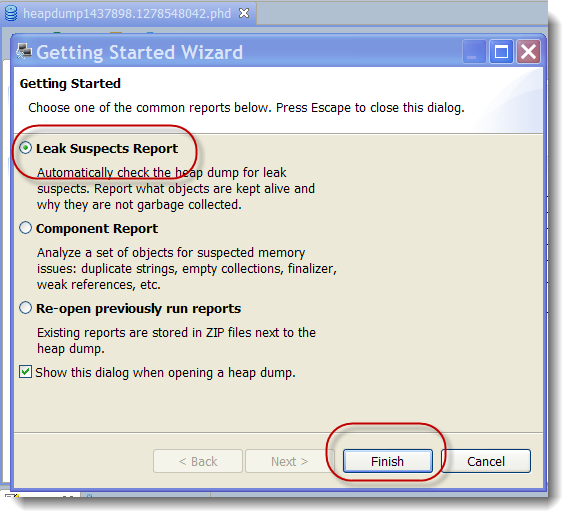
4) Once parsing is completed, select Leak Suspects and click Finish

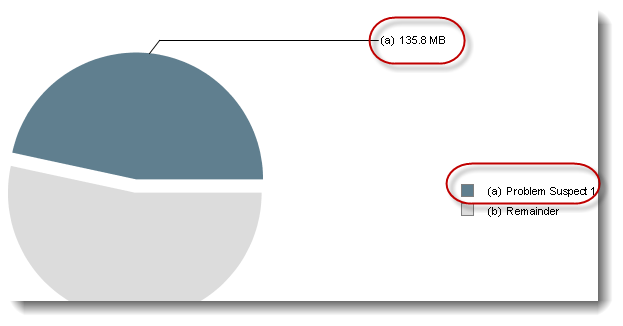
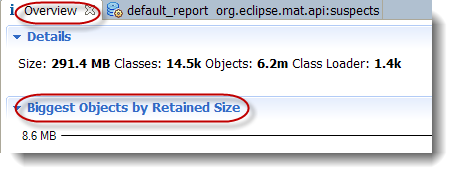
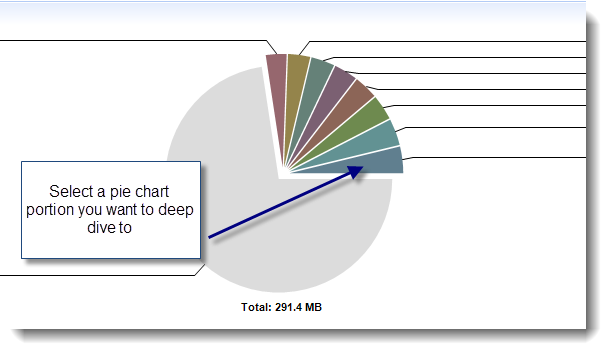
At this point you should get a pie chart with a list of potential leak suspects. In our example, the tool found one leak suspect as per below. This does not mean necessarily that you are facing a memory leak. The tool is simply presenting you with possible leak candidates or components using larger portion of your Java Heap memory.

5) Leak suspect analysis
The next step is to scroll down and have a closer look at your leak suspects. As you can see in our example below, the primary problem is that our Weblogic Session Data (client HttpSession object) is showing a footprint between 4.5 MB – 11.5 MB; much larger than the original size before this application change (~ 1 MB).
6) Memory footprint deep dive
The next step is to do a deep dive and better understand why our session data size is so big e.g. what the main application contributors are.
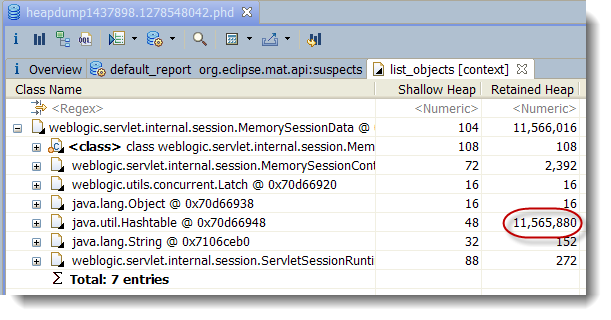
For this exercise, click on the Overview tab and left click a portion of the pie chart you are interesting in. You will see a menu with a list of options; select List objects > with outgoing references. A new tab will then open allowing you to inspect this Object data further. At this point, you just need to explode the object references and navigate through all object relationships from up to bottom.


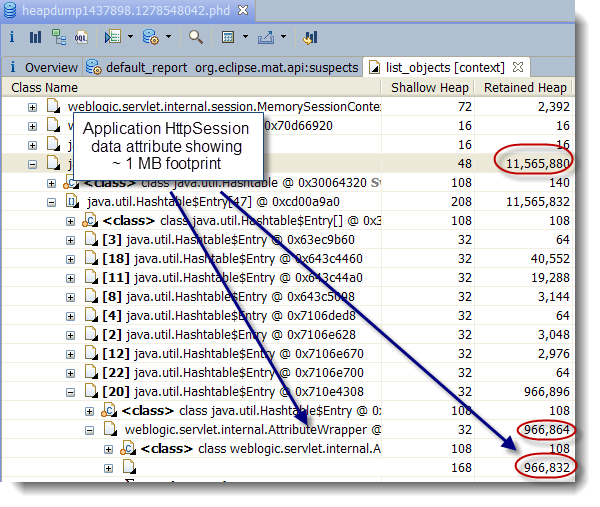
In our example, we did choose to inspect a Weblogic session data object of 11.5 MB. The idea is now to navigate through object references until we find the root cause. A Weblogic session data is basically a Hashtable that contain a list of attribute objects. Each of such object instances normally represents an attribute from your application HttpSession data. The analysis found several object instances from our application using close to 1 MB of data footprint.


Root cause and resolution
The Heap Dump analysis did reveal some very clear problems with a few of our application code client session attribute objects using too much Java Heap memory. Such analysis did allow us to fix the problem without further need to profile our application.
Additional JVM Heap Dump snapshots were captured post code fix and were analysed in order to confirm problem resolution.
This Heap Dump analysis did clearly demonstrate how powerful such Heap Dump data is when combined with a tool like Memory Analyzer.
Heap Dump files allow you to perform a fast analysing of your application footprint without any need to install additional application profilers. There are some scenarios that you will need a real application profiler but Heap Dump analysis is quite sufficient in several scenarios and is available out-of-the-box for most JVM vendors.


3 comments:
Hi P-H,
When I was trying to open phd file but I am getting
Error for all files while opening heap dump like 'heapdump.20101117.141228.1015882.phd'. Check the error log for further details.
Error opening heap dump 'heapdump.20100728.164519.966772.phd'. Check the error log for further details.
Error opening heap dump 'heapdump.20100728.164519.966772.phd'. Check the error log for further details.
Not a HPROF heap dump (java.io.IOException)
Not a HPROF heap dump
Regards,
Sujit
Hi Sujit,
This is because you need the IBM Heap Dump adapter. The simplest way is to use MAT directly from the IBM Support Assistant tool. Please follow the instructions below:
1) Download the free IBM Support Assistant (ISA) tool
http://javaeesupportpatterns.blogspot.com/2011/11/memory-analyzer-download.html
2) Launch ISA and add the IBM Monitoring and Diagnostic Tools for Java - Memory Analyzer add-on using the "Find New Tool Add-ons" from the "Analyze Problem" section
3) Launch the Memory Analyzer tool and load your Heap Dump in phd format.
Hope this helps.
P-H
Hi P-H,
Yes, its working now, Thanks a lot for your help.
Regards,
Sujit
Post a Comment