This article will provide you with a step by step tutorial on how you can pinpoint root cause of Java class loader memory leak related problems.




A recent class loader leak problem found from a Weblogic Integration 9.2 production system on AIX 5.3 (using the IBM Java VM 1.5) will be used as a case study and will provide you with complete root cause analysis steps.
Environment specifications (case study)
· Java EE server: Oracle Weblogic Integration 9.2 MP2
· OS: AIX 5.3 TL9 64-bit
· JDK: IBM VM 1.5.0 SR6 - 32-bit
· Java VM arguments: -server -Xms1792m -Xmx1792m -Xss256k
· Platform type: Middle tier - Order Provisioning System
Monitoring and troubleshooting tools
· IBM Thread Dump (javacore.xyz.txt format)
· IBM AIX 5.3 svmon command
· IBM Java VM 1.5 Heap Dump file (heapdump.xyz.phd format)
· IBM Support Assistant 4.1 - Memory Analyzer 0.6.0.2 (Heap Dump analysis)
Introduction
Java class loader memory leak can be quite hard to identify. The first challenge is to determine that you are really facing a class loader leak vs. other Java Heap related memory problems. Getting OutOfMemoryError from your log is often the first symptom; especially when the Thread is involved in a class loading call, creation of Java Thread etc.
If you are reading this article, chances are that you already did some analysis and are suspecting a class loader leak at the source of your problem. I will still show how you can confirm your problem is 100% due to a class loader leak.
Step #1 – AIX native memory monitoring and problem confirmation
Your first task is to determine if your memory problem and/or OutOfMemoryError is really caused by a depletion of your native memory segments. If you are not familiar with this, I suggest you first go through my other article that will explain you how to monitor native memory on AIX 5.3 of your IBM Java VM process on AIX 5.3.
Using the AIX svmon command, the idea is to monitor and build a native memory comparison matrix, on a regular basis as per below. In our case study production environment, the native memory capacity is 768 MB (3 segments of 256MB).
As you can see below, the native memory is clearly leaking at a rate of 50-70MB daily.
Date
|
Weblogic Instance Name
|
Native Memory (MB)
|
Native memory delta increase (MB)
|
20-Apr-11
|
Node1
|
530
|
+ 54 MB
|
Node2
|
490
|
+65 MB
| |
Node3
|
593
|
+70 MB
| |
Node4
|
512
|
+50 MB
|
Date
|
Weblogic Instance Name
|
Native Memory (MB)
|
19-Apr-11
|
Node1
|
476
|
Node2
|
425
| |
Node3
|
523
| |
Node4
|
462
|
This approach will allow you to confirm that your problem is related to native memory and also understand the rate of the leak itself.
Step #2 – Loaded classes and class loader monitoring
At this point, the next step is to determine if your native memory leak is due to class loader leak. Java objects like class descriptors, method names, Threads etc. are stored mainly in the native memory segments since these objects are more static in nature.
A simple way to keep track on your class loader stats is to generate a few IBM VM Thread Dump on a daily basis as per below explanations:
First, identify the PID of your Java process and generate a Thread Dump via the kill -3 command.

** kill -3 is actually not killing the process, simply generating a running JVM snapshot and is really low risk for your production environment **
This command will generate an IBM VM format Thread Dump at the root of your Weblogic domain.

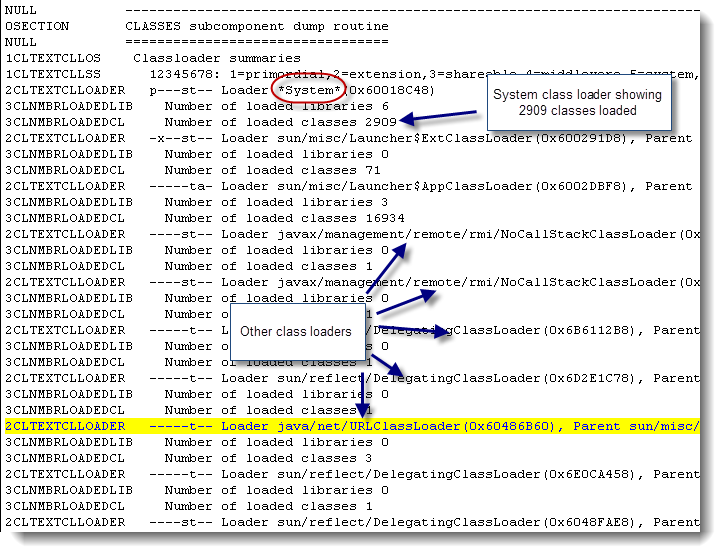
Now open the Thread Dump file with an editor of your choice and look for the following keyword:
CLASSES subcomponent dump routine
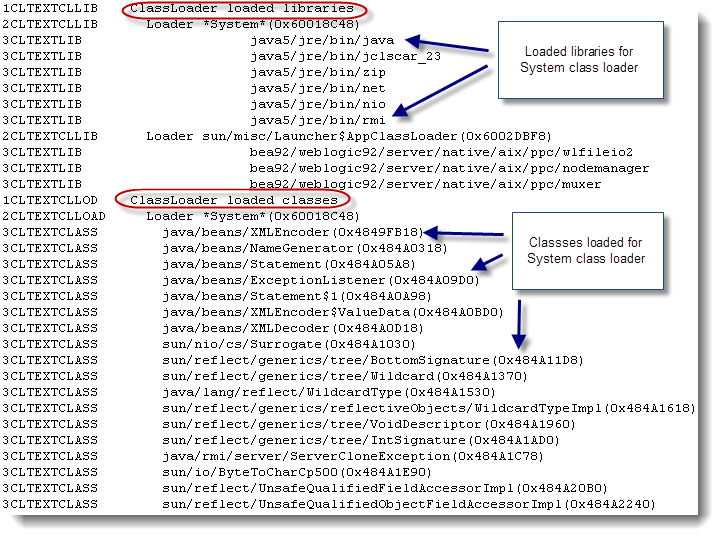
This section provides you full detail on the # of class loaders in your Java VM along with # of class instances for each class loader


You can keep track on the total count of class loader instances by running a quick grep command:
grep -c '2CLTEXTCLLOAD' <javacore.xyz.txt file>
You can keep track on the total count of class instances by running a quick grep command:
grep -c '3CLTEXTCLASS' <javacore.xyz.txt file>
For our case study, the number of class loaders and classes found was very huge and showing an increase on a daily basis.
· 3CLTEXTCLASS : ~ 52000 class instances
· 2CLTEXTCLLOAD: ~ 21000 class loader instances
Step #3 – Loaded classes and class loader delta increase and culprit identification
This step requires you to identify the source of the increase. By looking at the class loader and class instances, you should be able to fairly easily identify a list of primary suspects that you can analyse further. This could be application class instances or even Weblogic classes. Leaking class instances could also be Java $Proxy instances created by dynamic class loading frameworks using the Java Reflection API.
In our scenario, we found an interesting leak of the number of $ProxyXYZ class increases referenced by the Weblogic Generic class loader.

This class instance type was by far the #1 contributor for all our class instances. Further monitoring of the native memory and class instances did confirm that the source of delta increase of class instances was due to a leak of $ProxyXYZ related instances.
Such $Proxy instances are created by the Weblogic Integration 9.2 BPM (business process management) engine during our application business processes and normally implemented and managed via java.lang.ref.SoftReference data structures and garbage collected when necessary. The Java VM is guaranteed to clear any SoftReference prior to an OutOfMemoryError so any such leak could be a symptom of hard references still active on the associated temporary Weblogic generic class loader.
The next step was to analyze the generated IBM VM Heap Dump file following an OutOfMemoryError condition.
Step #4 - Heap Dump analysis
A Heap Dump file is generated by default from the IBM Java VM 1.5 following an OutOfMemoryError. A Java VM heap dump file contains all information on your Java Heap memory but can also help you pinpoint class loader native memory leaks since it also provides detail on the class loader objects as pointers to the real native memory objects.
Find below a step by step Heap Dump analysis conducted using the ISA 4.1 tool (Memory Analyzer).
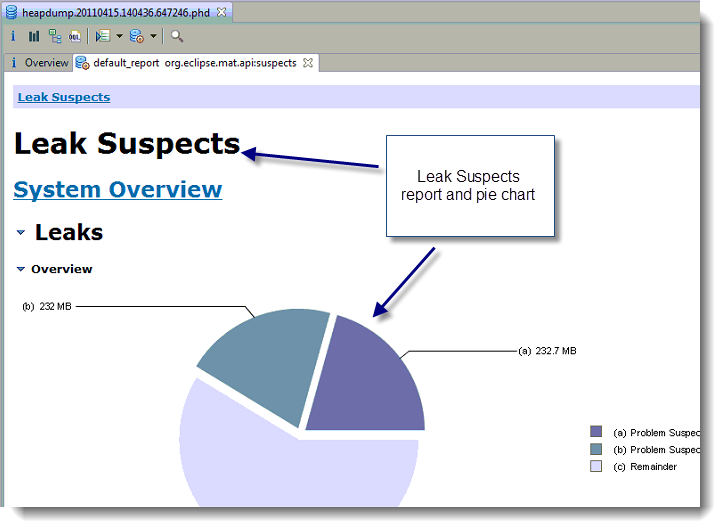
1) Open IAS and load the Heap Dump (heapdump.xyz.phd format) and select the Leak Suspects Report in order to have a look at the list of memory leak suspects

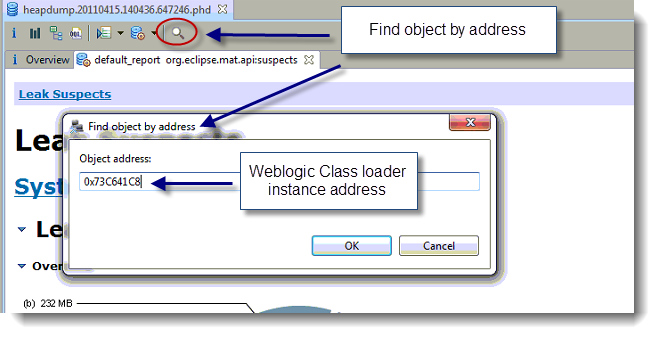
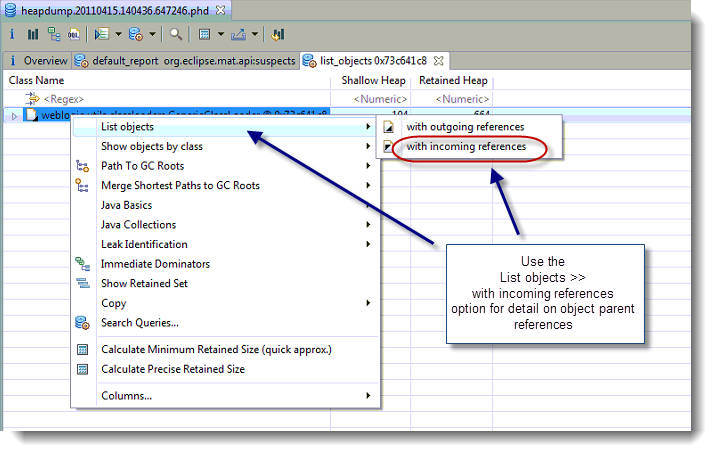
2) Once you find the source of class instance leak, the easiest way to analyze next is to use the find by address function from the tool and deep dive further
** In our case, the key question mark was why the Weblogic class loader itself was still referenced and still keeping hard reference to such $Proxy instances **


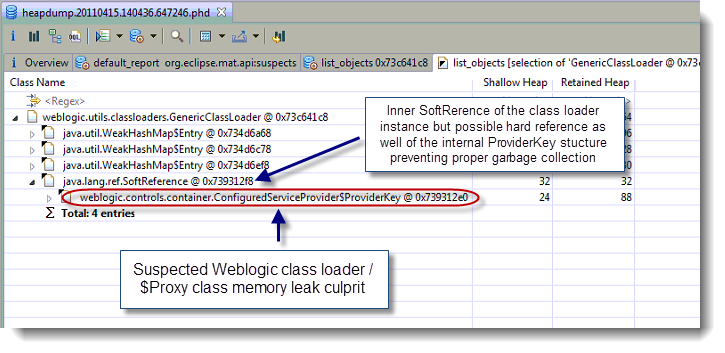
3) The final step was to deep dive within one sample of Weblogic Generic class loader instance (0x73C641C8) and attempt to pinpoint the culprit parent referrer


As you can see from the snapshot, the inner class weblogic/controls/container/ConfiguredServiceProvider$ProviderKey was identified as the primary suspect and potential culprit of the problem.
Potential root cause and conclusion
As per the Heap Dump analysis. This data structure appear to be maintaining a list of java.lang.ref.SoftReference for the generated class loader instances but also appear to be holding hard references; preventing the Java VM to garbage collect the unused Weblogic Generic class loader instances and its associated $Proxy instances.
Further analysis of the Weblogic code will be required by Oracle support along with some knowledge base database research as this could be a known issue of the WLI 9.2 BPM.
I hope this tutorial will help you in your class loader leak analysis when using an IBM Java VM, please do not hesitate to post any comment or question on the subject.
Solution and next steps
We are discussing this problem right now with the Oracle support team and I will keep you informed of the solution as soon as possible so please stay tuned for more update on this post.

2 comments:
Has Oracle released any fix to this .
Yes, this memory leak got resolved when upgrading to Oracle WebLogic integration version 10.0
Thanks.
P-H
Post a Comment