This article will provide you some background on the Java HotSpot PermGen space and a 4 steps process on how you can monitor and tune your PermGen space for your Weblogic Java EE server.
Java HotSpot PermGen overview
PermGen tuning step #3 – Review your current PermGen runtime footprint
** A Weblogic managed server(s) restart will be required in order to activate your new PermGen space settings. **
Java HotSpot PermGen overview
The HotSpot PermGen (Permanent Generation) is a memory space specific to the Sun Java HotSpot VM and also applicable for any other Java EE server using the HotSpot VM such as Red Hat JBoss or IBM WAS. It is a special memory space for Class descriptors and other internal JVM objects.
Please refer to my other Blog article on the Java HotSpot VM memory space breakdown for a quick visual overview of all HotSpot memory spaces.
If you are facing any PermGen related problem such as OutOfMemoryError, please refer to my Blog article OutOfMemoryError PermGen patterns for description and troubleshooting of the most common Weblogic PermGen issues.
PermGen tuning step #1 – Identify your JVM vendor
First, please make sure that PermGen space is actually applicable for your Java EE environment. JVM’s such as IBM SDK and Oracle JRockit do not have an actual PermGen space. For those VM’s, the memory is allocated either to the Java Heap or the native C Heap.
** PermGen space is only applicable for the Sun Java HotSpot VM 1.4, 1.5 & 1.6. There are actually some requests for enhancements for JDK 1.7 that may actually eliminate the PermGen and use the native C memory instead for the VM's representation of the Java program (Class descriptors / code). **
PermGen tuning step #2 – Review your current PermGen space settings
The minimum and maximum PermGen space configuration is achieved via the following parameters:
## Example: PermGen space with a minimum size of 256 MB
-XX:PermSize=256m
## Example: PermGen space with a maximum size of 256 MB
-XX:MaxPermSize=512m
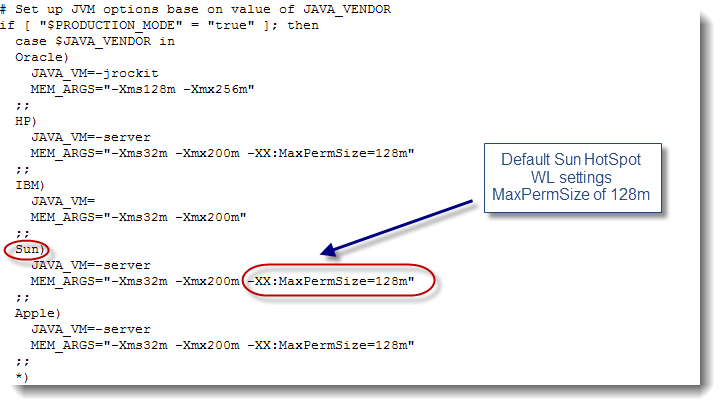
The default Weblogic PermGen space settings are normally found from the commEnv.sh / commEnv.cmd scripts and located under:
<WL11g HOME>/wlserver_10.3/common/bin/
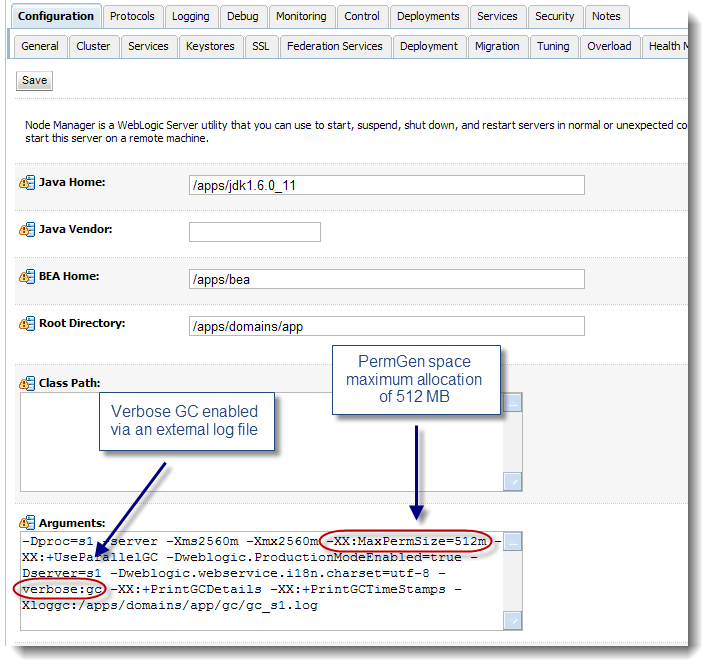
When using Weblogic Nodemanager to start and stop your managed servers (used by most Weblogic production systems), PermGen settings can be updated via the Weblogic console under >>> Home / Managed server 1...n / Server Start / Arguments field:
PermGen tuning step #3 – Review your current PermGen runtime footprint
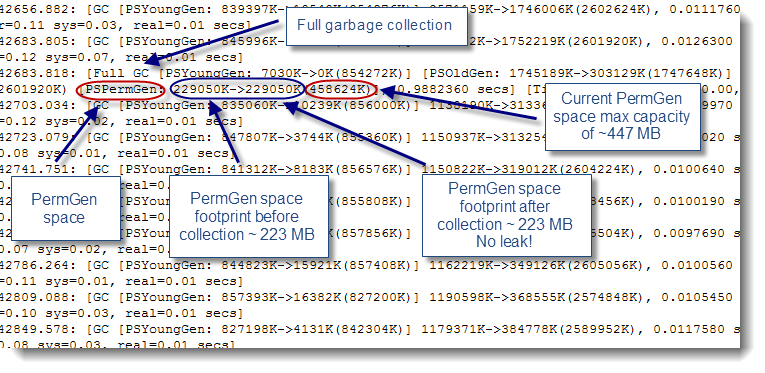
PermGen space capacity and footprint can be analyzed by turning on verbose GC and monitoring the Full GC collections on a daily basis. This will allow you to determine your current PermGen footprint and identify any potential issue such as PermGen memory leak.
Verbose GC for the HotSpot VM can be enabled by simply adding the parameters below to your start-up VM parameters:
## Example: Enable verbose GC and print the output to a custom log
-verbose:gc -XX:+PrintGCDetails -XX:+PrintGCTimeStamps -Xloggc:/apps/domains/app/gc/gc_s1.log
You can also use the free open source tool GC Viewer to graphically review your Java Heap memory footprint from the GC output data.
A bigger PermGen space requirement is to be expected for applications using a significant amount of code and class-loader trees e.g. many EAR files and / or applications using frameworks that depend heavily on dynamic class-loading / Refection API.
PermGen tuning step #4 – Tune your PermGen space, if required
Increasing your maximum capacity of the PermGen space is often required but you first need to ensure that you are not facing a memory leak such as class-loader leak. Please review your verbose GC output very closely and ensure that it is not growing constantly on a daily basis. You may need several days to confirm a PermGen memory leak since applications such Weblogic portal using dynamic JSP reload may increase the PermGen utilization over time (until all your JSP’s are compiled; loaded to their class-loader).
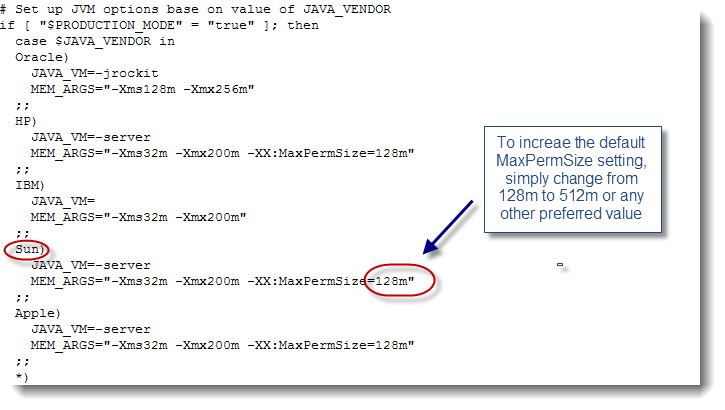
In order to increase your PermGen space to let’s say 512 MB, simply edit the Weblogic commEnv.sh or commEnv.cmd script and change the default from 128m to 512m or add / modify the MaxPermSize to 512m (-XX:MaxPermSize=512m) via the Server Start arguments (as per step #2 Weblogic console snapshot) if using Nodemanager.
** A Weblogic managed server(s) restart will be required in order to activate your new PermGen space settings. **

1 comments:
Thank you very much for sharing this. It's really helpful
We just started to deploy and run our first ADF applications. The application is deployed to cluster which consists of two managed servers ADF1 (resides on the same machine as Admin server – HOST1) and ADF2 (resides on another host – HOST2). We have two medium size ADF applications deployed to cluster.
After rebooting the machine I already saw that heap size is about of 50% of usage on both managed servers. However there are 0 sessions running on both managed servers.
After changing default JAVA Memory arguments in setDomainEnv.sh on both hosts
From:
-Xms256m -Xmx512m -XX:CompileThreshold=8000 -XX:PermSize=128m -XX:MaxPermSize=512m
To:
MEASUREMENT_ARGS="-verbose:gc -XX:+PrintGCDetails -XX:+PrintGCTimeStamps"
export MEASUREMENT_ARGS
USER_MEM_ARGS="${MEASUREMENT_ARGS} -Xms1024m -Xmx1024m -XX:PermSize=512m -XX:MaxPermSize=512m"
export USER_MEM_ARGS
I am still getting up to 33% of Heap already used.
So my question is why the heap is already used by 33% after rebooting the servers when no sessions are running on the server?
System parameters:
Operating system RHEL 6.2 64 bit
/u01/app/oracle/product/fmw/jdk1.7.0_17/bin> ./java -version
java version "1.7.0_17"
Java(TM) SE Runtime Environment (build 1.7.0_17-b02)
Java HotSpot(TM) 64-Bit Server VM (build 23.7-b01, mixed mode)
Thank you in advance
Alex
Post a Comment