/ Java EE Support Patterns

2.22.2012

How to analyze Thread Dump – Part 3: HotSpot VM

This is part 3 of our Thread Dump analysis series which will provide you with an overview of what is a JVM Thread Dump for the HotSpot VM and the different Threads that you will find. Detail for the IBM VM Thread Dump format will be provided in the part 4.

** UPDATE: Thread Dump analysis tutorial videos now available here.

Please note that you will find the Thread Dump sample used for this article from the root cause analysis forum.

JVM Thread Dump – what is it?

A JVM Thread Dump is a snapshot taken at a given time which provides you with a complete listing of all created Java Threads.

Each individual Java Thread found gives you information such as:

-        Thread name; often used by middleware vendors to identify the Thread Id along with its associated Thread Pool name and state (running, stuck etc.)

-        Thread type & priority ex: daemon prio=3 ** middleware softwares typically create their Threads as daemon meaning their Threads are running in background; providing services to its user e.g. your Java EE application **

-        Java Thread ID ex: tid=0x000000011e52a800 ** This is the Java Thread Id obtained via java.lang.Thread.getId() and usually implemented as an auto-incrementing long 1..n**

-        Native Thread ID ex: nid=0x251c** Crucial information as this native Thread Id allows you to correlate for example which Threads from an OS perspective are using the most CPU within your JVM etc. **

-        Java Thread State and detail ex: waiting for monitor entry [0xfffffffea5afb000] java.lang.Thread.State: BLOCKED (on object monitor)
** Allows to quickly learn about Thread state and its potential current blocking condition **

-        Java Thread Stack Trace; this is by far the most important data that you will find from the Thread Dump. This is also where you will spent most of your analysis time since the Java Stack Trace provides you with 90% of the information that you need in order to pinpoint root cause of many problem pattern types as you will learn later in the training sessions

-        Java Heap breakdown; starting with HotSpot VM 1.6, you will also find at the bottom of the Thread Dump snapshot a breakdown of the HotSpot memory spaces utilization such as your Java Heap (YoungGen, OldGen) & PermGen space. This is quite useful when excessive GC is suspected as a possible root cause so you can do out-of-the-box correlation with Thread data / patterns found

Heap
 PSYoungGen      total 466944K, used 178734K [0xffffffff45c00000, 0xffffffff70800000, 0xffffffff70800000)
  eden space 233472K, 76% used [0xffffffff45c00000,0xffffffff50ab7c50,0xffffffff54000000)
  from space 233472K, 0% used [0xffffffff62400000,0xffffffff62400000,0xffffffff70800000)
  to   space 233472K, 0% used [0xffffffff54000000,0xffffffff54000000,0xffffffff62400000)
 PSOldGen        total 1400832K, used 1400831K [0xfffffffef0400000, 0xffffffff45c00000, 0xffffffff45c00000)
  object space 1400832K, 99% used [0xfffffffef0400000,0xffffffff45bfffb8,0xffffffff45c00000)
 PSPermGen       total 262144K, used 248475K [0xfffffffed0400000, 0xfffffffee0400000, 0xfffffffef0400000)
  object space 262144K, 94% used [0xfffffffed0400000,0xfffffffedf6a6f08,0xfffffffee0400000)

Thread Dump breakdown overview

In order for you to better understand, find below a diagram showing you a visual breakdown of a HotSpot VM Thread Dump and its common Thread Pools found:


As you can there are several pieces of information that you can find from a HotSpot VM Thread Dump. Some of these pieces will be more important than others depending of your problem pattern (problem patterns will be simulated and explained in future articles).

For now, find below a detailed explanation for each Thread Dump section as per our sample HotSpot Thread Dump:

# Full thread dump identifier
This is basically the unique keyword that you will find in your middleware / standalong Java standard output log once you generate a Thread Dump (ex: via kill -3 <PID> for UNIX). This is the beginning of the Thread Dump snapshot data.

Full thread dump Java HotSpot(TM) 64-Bit Server VM (20.0-b11 mixed mode):

# Java EE middleware, third party & custom application Threads
This portion is the core of the Thread Dump and where you will typically spend most of your analysis time. The number of Threads found will depend on your middleware software that you use, third party libraries (that might have its own Threads) and your application (if creating any custom Thread, which is generally not a best practice).

In our sample Thread Dump, Weblogic is the middleware used. Starting with Weblogic 9.2, a self-tuning Thread Pool is used with unique identifier “'weblogic.kernel.Default (self-tuning)”

"[STANDBY] ExecuteThread: '414' for queue: 'weblogic.kernel.Default (self-tuning)'" daemon prio=3 tid=0x000000010916a800 nid=0x2613 in Object.wait() [0xfffffffe9edff000]
   java.lang.Thread.State: WAITING (on object monitor)
        at java.lang.Object.wait(Native Method)
        - waiting on <0xffffffff27d44de0> (a weblogic.work.ExecuteThread)
        at java.lang.Object.wait(Object.java:485)
        at weblogic.work.ExecuteThread.waitForRequest(ExecuteThread.java:160)
        - locked <0xffffffff27d44de0> (a weblogic.work.ExecuteThread)
        at weblogic.work.ExecuteThread.run(ExecuteThread.java:181)

# HotSpot VM Thread
This is an internal Thread managed by the HotSpot VM in order to perform internal native operations. Typically you should not worry about this one unless you see high CPU (via Thread Dump & prstat / native Thread id correlation).

"VM Periodic Task Thread" prio=3 tid=0x0000000101238800 nid=0x19 waiting on condition


# HotSpot GC Thread
When using HotSpot parallel GC (quite common these days when using multi physical cores hardware), the HotSpot VM create by default or as per your JVM tuning a certain # of GC Threads. These GC Threads allow the VM to perform its periodic GC cleanups in a parallel manner, leading to an overall reduction of the GC time; at the expense of increased CPU utilization.

"GC task thread#0 (ParallelGC)" prio=3 tid=0x0000000100120000 nid=0x3 runnable
"GC task thread#1 (ParallelGC)" prio=3 tid=0x0000000100131000 nid=0x4 runnable
………………………………………………………………………………………………………………………………………………………………

This is crucial data as well since when facing GC related problems such as excessive GC, memory leaks etc, you will be able to correlate any high CPU observed from the OS / Java process(es) with these Threads using their native id value (nid=0x3). You will learn how to identify and confirm this problem is future articles.

# JNI global references count
JNI (Java Native Interface) global references are basically Object references from the native code to a Java object managed by the Java garbage collector. Its role is to prevent collection of an object that is still in use by native code but technically with no "live" references in the Java code.

It is also important to keep an eye on JNI references in order to detect JNI related leaks. This can happen if you program use JNI directly or using third party tools like monitoring tools which are prone to native memory leaks.

JNI global references: 1925

# Java Heap utilization view
This data was added back to JDK 1 .6 and provides you with a short and fast view of your HotSpot Heap. I find it quite useful when troubleshooting GC related problems along with HIGH CPU since you get both Thread Dump & Java Heap in a single snapshot allowing you to determine (or to rule out) any pressure point in a particular Java Heap memory space along with current Thread computing currently being done at that time. As you can see in our sample Thread Dump, the Java Heap OldGen is maxed out!

Heap
 PSYoungGen      total 466944K, used 178734K [0xffffffff45c00000, 0xffffffff70800000, 0xffffffff70800000)
  eden space 233472K, 76% used [0xffffffff45c00000,0xffffffff50ab7c50,0xffffffff54000000)
  from space 233472K, 0% used [0xffffffff62400000,0xffffffff62400000,0xffffffff70800000)
  to   space 233472K, 0% used [0xffffffff54000000,0xffffffff54000000,0xffffffff62400000)
 PSOldGen        total 1400832K, used 1400831K [0xfffffffef0400000, 0xffffffff45c00000, 0xffffffff45c00000)
  object space 1400832K, 99% used [0xfffffffef0400000,0xffffffff45bfffb8,0xffffffff45c00000)
 PSPermGen       total 262144K, used 248475K [0xfffffffed0400000, 0xfffffffee0400000, 0xfffffffef0400000)
  object space 262144K, 94% used [0xfffffffed0400000,0xfffffffedf6a6f08,0xfffffffee0400000)

I hope this article has helped to understand the basic view of a HotSpot VM Thread Dump.

The Thread Dump Analysis Part 4 is now available and will provide you a high level overview of a Thread Dump and breakdown for the IBM VM 1.6 Thread Dump format.
2.16.2012

Java Heap Space – IBM VM

This short article will provide you with a high level overview of the different Java memory spaces for the IBM VM. 

This understanding is quite important given the implementation & naming convention differences between HotSpot & IBM VM.

IBM VM: 2 different memory spaces

The IBM VM memory is split between 2 memory spaces:

-        The Java Heap (nursery and tenured spaces)
-        The Native Heap (C-Heap)

Memory Space
Start-up arguments and tuning
Monitoring strategies
Description
Java Heap
-Xmx (maximum Heap space)

-Xms (minimum Heap size)

EX:
-Xmx1024m
-Xms1024m

GC policy Ex:
-Xgcpolicy:gencon (enable gencon GC policy)
- verbose GC
- JMX API
- IBM monitoring tools
The IBM Java Heap is typically split between the nursery and tenured space (YoungGen, OldGen).

The gencon GC policy (combo of concurrent and generational GC) is typically used for Java EE platforms in order to minimize the GC pause time.


Native Heap
 (C-Heap)
Not configurable directly.

For a 32-bit VM, the C-Heap capacity = 4 Gig – Java Heap

For a 64-bit VM, the C-Heap capacity = Physical server total RAM & virtual memory – Java Heap

- svmon command
The C-Heap is storing class metadata objects including library files, other JVM and third party native code objects.

 Where is the PermGen space?

This is by far the most typical question I get from Java EE support individuals supporting an IBM VM environment for this first time. The answer: there is no PermGen space for the IBM VM. The PermGen space is only applicable to the HotSpot VM. The IBM VM is using the Native Heap for Class metadata related data. Also, as you probably saw from my other article, Oracle / Sun is also starting to remove the PermGen space for the HotSpot VM.

The next article will provide you a tutorial on how to enable and analyze verbose GC for an IBM VM. Please feel free to post any comment or question on the IBM VM.

2.09.2012

Java Heap Space: What is it?

This article will provide you with a high level overview of the Java Heap Space and will help improve your knowledge in this area.

Additional complementary articles are provided at the end of this post. 

Background

When learning Java for the first time, a lot of focus is often spent on the Java language itself, Object-oriented programming principles, design patterns, compilation etc. and not so much on the Java VM itself such as the Java Heap memory management, garbage collection, performance tuning which are often considered “advanced” topics.

A beginner Java or Java EE programmer ends up creating his first program or Web application. Java Heap memory problems are then often observed such as OutOfMemoryError which can be quite challenging for Java beginners or even intermediates to troubleshoot.

Sounds familiar?

Java Heap Space – Overview & life cycle

Proper knowledge of the Java VM Heap Space is critical; including for Java beginner so my recommendation to you is to learn these principles at the same time you learn the Java language technicalities.

Your Java VM is basically the foundation of your Java program which provides you with dynamic memory management services, garbage collection, Threads, IO and native operations and more.

The Java Heap Space is the memory “container” of you runtime Java program which provides to your Java program the proper memory spaces it needs (Java Heap, Native Heap) and managed by the JVM itself.

Your Java program life cycle typically looks like this:

-        Java program coding (via Eclipse IDE etc.) e.g. HelloWorld.java
-        Java program compilation (Java compiler or third party build tools such as Apache Ant, Apache Maven..) e.g. HelloWord.class
-        Java program start-up and runtime execution e.g. via your HelloWorld.main() method

The Java Heap space is mainly applicable and important for the third step: runtime execution. For the HotSpot VM, the Java Heap Space is split in 3 silos:

-        Java Heap for short & long lived objects (YoungGen & OldGen spaces)
-        PermGen space
-        Native Heap

Now let’s dissect your HelloWorld.class program so you can better understand.

-        At start-up, your JVM will load and cache some of your static program and JDK libraries to the Native Heap, including native libraries, Mapped Files such as your program Jar file(s), Threads such as the main start-up Thread of your program etc.
-        Your JVM will then store the “static” data of your HelloWorld.class Java program to the PermGen space (Class metadata, descriptors..)
-        Once your program is started, the JVM will then manage and dynamically allocate the memory of your Java program to the Java Heap (YoungGen & OldGen). This is why it is so important that you understand how much memory your Java program needs to you can properly fine-tuned the capacity of your Java Heap controlled via –Xms & -Xmx JVM parameters. Profiling, Heap Dump analysis allow you to determine your Java program memory footprint
-        Finally, the JVM has to also dynamically release the memory from the Java Heap Space that your program no longer need; this is called the garbage collection process. This process can be easily monitored via the JVM verbose GC or a monitoring tool of your choice such as Java VisualVM.

Sounds complex? The good news is that the JVM maturity has improved significantly over the last 10 years and provides you with out-of-the-box tools allowing you to understand your Java program Java Heap allocation monitor it and fine-tuned.

Related posts & case studies

I suggest that you review the articles below for more detail on this topic. You will also find from this Blog several case studies on OutOfMemoryError related problems and resolution strategies.

For any question or additional help please simply post a comment or question below this article. You can also email me directly @phcharbonneau@hotmail.com.

2.08.2012

Too many open files – Case Study

This case study describes the complete root cause analysis and resolution of a File Descriptor (Too many open files) related problem that we faced following a migration from Oracle ALSB 2.6 running on Solaris OS to Oracle OSB 11g running on AIX.

This article will also provide you with proper AIX OS commands you can use to troubleshoot and validate the File Descriptor configuration of your Java VM process.

Environment specifications

-        Java EE server: Oracle Service Bus 11g
-        Middleware OS: IBM AIX 6.1
-        Java VM: IBM JRE 1.6.0 SR9 – 64 bit
-        Platform type: Service Bus – Middle Tier

Problem overview

-        Problem type: java.net.SocketException: Too many open files error was observed under heavy load causing our Oracle OSB managed servers to suddenly hang

Such problem was observed only during high load and did require our support team to take corrective action e.g. shutdown and restart the affected Weblogic OSB managed servers

Gathering and validation of facts

As usual, a Java EE problem investigation requires gathering of technical and non technical facts so we can either derived other facts and/or conclude on the root cause. Before applying a corrective measure, the facts below were verified in order to conclude on the root cause:

·        What is the client impact? HIGH; Full JVM hang
·        Recent change of the affected platform? Yes, recent migration from ALSB 2.6 (Solaris OS) to Oracle OSB 11g (AIX OS)
·        Any recent traffic increase to the affected platform? No
·        What is the health of the Weblogic server? Affected managed servers were no longer responsive along with closure of the Weblogic HTTP (Server Socket) port
·        Did a restart of the Weblogic Integration server resolve the problem? Yes but temporarily only

-        Conclusion #1: The problem appears to be load related

Weblogic server log files review

A quick review of the affected managed servers log did reveal the error below:

java.net.SocketException: Too many open files

This error indicates that our Java VM process was running out of File Descriptor. This is a severe condition that will affect the whole Java VM process and cause Weblogic to close its internal Server Socket port (HTTP/HTTPS port) preventing any further inbound & outbound communication to the affected managed server(s).

File Descriptor – Why so important for an Oracle OSB environment?

The File Descriptor capacity is quite important for your Java VM process. The key concept you must understand is that File Descriptors are not only required for pure File Handles but also for inbound and outbound Socket communication. Each new Java Socket created to (inbound) or from (outound) your Java VM by Weblogic kernel Socket Muxer requires a File Descriptor allocation at the OS level.

An Oracle OSB environment can require a significant number of Sockets depending how much inbound load it receives and how much outbound connections (Java Sockets) it has to create in order to send and receive data from external / downstream systems (System End Points).

For that reason, you must ensure that you allocate enough File Descriptors / Sockets to your Java VM process in order to support your daily load; including problematic scenarios such as sudden slowdown of external systems which typically increase the demand on the File Descriptor allocation.

Runtime File Descriptor capacity check for Java VM and AIX OS

Following the discovery of this error, our technical team did perform a quick review of the current observed runtime File Descriptor capacity & utilization of our OSB Java VM processes. This can be done easily via the AIX procfiles <Java PID> | grep rlimit & lsof -p <Java PID> | wc –l commands as per below example:

## Java VM process File Descriptor total capacity

>> procfiles 5425732 | grep rlimit
  Current rlimit: 2000 file descriptors

## Java VM process File Descriptor current utilization

>> lsof -p <Java PID> | wc –l
  1920

As you can see, the current capacity was found at 2000; which is quite low for a medium size Oracle OSB environment. The average utilization under heavy load was also found to be quite close to the upper limit of 2000.

The next step was to verify the default AIX OS File Descriptor limit via the ulimit -S –n command:

>> ulimit -S –n
  2000

-        Conclusion #2: The current File Descriptor limit for both OS and OSB Java VM appears to be quite low and setup at 2000. The File Descriptor utilization was also found to be quite close to the upper limit which explains why so many JVM failures were observed at peak load

Weblogic File Descriptor configuration review

The File Descriptor limit can typically be overwritten when you start your Weblogic Java VM. Such configuration is managed by the WLS core layer and script can be found at the following location:

<WL_HOME>/wlserver_10.3/common/bin/commEnv.sh

..................................................
resetFd() {
  if [ ! -n "`uname -s |grep -i cygwin || uname -s |grep -i windows_nt || \
       uname -s |grep -i HP-UX`" ]
  then
    ofiles=`ulimit -S -n`
    maxfiles=`ulimit -H -n`
    if [ "$?" = "0" -a  `expr ${maxfiles} : '[0-9][0-9]*$'` -eq 0 -a `expr ${ofiles} : '[0-9][0-9]*$'` -eq 0 ]; then
      ulimit -n 4096
    else
      if [ "$?" = "0" -a `uname -s` = "SunOS" -a `expr ${maxfiles} : '[0-9][0-9]*$'` -eq 0 ]; then
        if [ ${ofiles} -lt 65536 ]; then
          ulimit -H -n 65536
        else
          ulimit -H -n 4096
        fi
      fi
    fi
  fi
.................................................

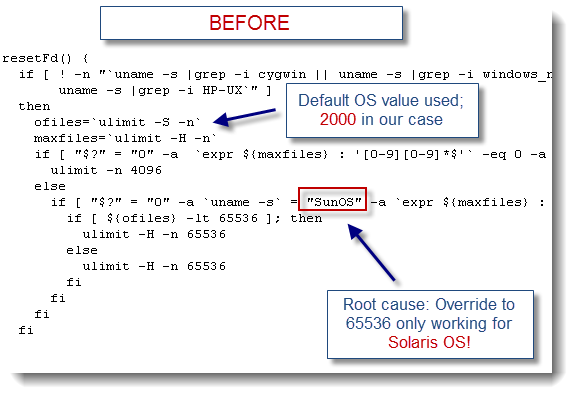
Root cause: File Descriptor override only working for Solaris OS!

As you can see with the script screenshot below, the override of the File Descriptor limit via ulimit is only applicable for Solaris OS (SunOS) which explains why our current OSB Java VM running on AIX OS did end up with the default value of 2000 vs. our older ALSB 2.6 environment running on Solaris OS which had a File Descriptor limit of 65536.


Solution: script tweaking for AIX OS

The resolution of this problem was done by modifying the Weblogic commEnv script as per below. This change did ensure a configuration of 65536 File Descriptor (from 2000); including for the AIX OS:


** Please note that the activation of any change to the Weblogic File Descriptor configuration requires a restart of both the Node Manager (if used) along with the managed servers. **

A runtime validation was also performed following the activation of the new configuration which did confirm the new active File Descriptor limit:

>> procfiles 6416839 | grep rlimit
  Current rlimit: 65536 file descriptors

No failure has been observed since then.

Conclusion and recommendations

-        When upgrading your Weblogic Java EE container to a new version, please ensure that you verify your current File Descriptor limit as per the above case study
-         From a capacity planning perspective, please ensure that you monitor your File Descriptor utilizaiton on a regular basis in order to identify any potential capacity problem, Socket leak etc..

Please don’t hesitate to post any comment or question on this subject if you need any additional help.

2.03.2012

PRSTAT Linux – How to pinpoint high CPU Java VM Threads

This article will provide you with an equivalent approach, for JVM on Linux OS, of the powerful Solaris OS prstat command; allowing you to quickly pinpoint the high CPU Java VM Thread contributors.

One key concept to understand for a Java VM running on the Linux OS is that Java threads are implemented as native Threads, which results in each thread being a separate Linux process.

Ok thanks for the info but why is this related to prstat?

Well this key concept means that you don’t need a prstat command for Linux. Since each Java VM Thread is implemented as a native Thread, each Thread CPU % can simply be extracted out-of-the-box using the top command.

You still need to generate Thread Dump data of your JVM process in order to correlate with the Linux top command output.

Thanks for this explanation. Now please show me how to do this

Please simply follow the instructions below:

1)     Execute the top command (press SHIFT-H to get the Threads toggle view) or use -H option (to show all Threads) and find the PID associated with your affected  / high CPU WLS process(es) (remember, many may show up since each Java Thread is implemented as a separate Linux process)
2)     Immediately after, generate a few Thread Dump snapshots using kill –3 <PID> of the parent WLS process. Thread Dump provides you with the complete list with associated Stack Trace of each Java Thread within your JVM process
3)     Now, convert the PID(s) extracted from the top command output to HEX format
4)     The next step is to search from the Thread Dump data for a match nid=<HEX PID>
5)     The final step is to analyze the affected Thread(s) and analyze the Stack Trace so you can determine where in the code is the problem (application code, middleware itself, JDK etc.)

Example: top command captured of a Weblogic Server Java Thread running at 40% CPU utilization along with Thread Dump data via kill -3 <PID>

## top output sample 
PID USER PRI NI SIZE RSS SHARE STAT %CPU %MEM TIME COMMAND
...........
22111 userWLS 9 0 86616 84M 26780 S 0.0 40.1 0:00 java

  • Decimal to HEX conversion of Java Thread (native Thread) 22111 >> 0x565F
  • Now using the HEX value, we can search within the Thread Dump for the following keyword: nid=0x565F

## Thread Dump output sample Thread as per the above search criteria nid=0x565F
"ExecuteThread: '0' for queue: 'default'" daemon prio=1 tid=0x83da550 nid=0x565F waiting on monitor [0x56138000..0x56138870]
  at java.util.zip.ZipFile.getEntry(Native Method)
  at java.util.zip.ZipFile.getEntry(ZipFile.java:172)
  at java.util.jar.JarFile.getEntry(JarFile.java:269)
  at java.util.jar.JarFile.getJarEntry(JarFile.java:252)
  at sun.misc.URLClassPath$JarLoader.getResource(URLClassPath.java:989)
  at sun.misc.URLClassPath$JarLoader.findResource(URLClassPath.java:967)
  at sun.misc.URLClassPath.findResource(URLClassPath.java:262)
  at java.net.URLClassLoader$4.run(URLClassLoader.java:763)
  at java.security.AccessController.doPrivileged(AccessController.java:224)
  at java.net.URLClassLoader.findResource(URLClassLoader.java:760)
  at java.lang.ClassLoader.getResource(ClassLoader.java:444)
  at java.lang.ClassLoader.getResourceAsStream(ClassLoader.java:504)
  ............................................

In the above example, the problem was related to an excessive class loading / IO problem.

As you can see, the approach did allow us to quickly pinpoint high CPU Thread contributor but you will need to spend additional time to analyze the root cause which is now your job.

Need any additional help?

I hope this short tutorial has helped you understand how you can pinpoint high CPU Thread contributors for your JVM running on the Linux OS.

For any question or additional help please simply post a comment or question below this article. You can also email me directly @phcharbonneau@hotmail.com.